

Sentiment: Bearish
Direction: Reversal
What Is The Ascending Broadening Wedge Chart Pattern?
An Ascending Broadening Wedge is a bearish chart pattern that commonly takes place at the end of a bullish trend as a reversal pattern.
Unlike other patterns where trend lines converge, upward sloping support and resistance lines diverge instead, creating a broadening structure that ultimately breaks down.
How To Identify The Ascending Broadening Wedge Pattern?
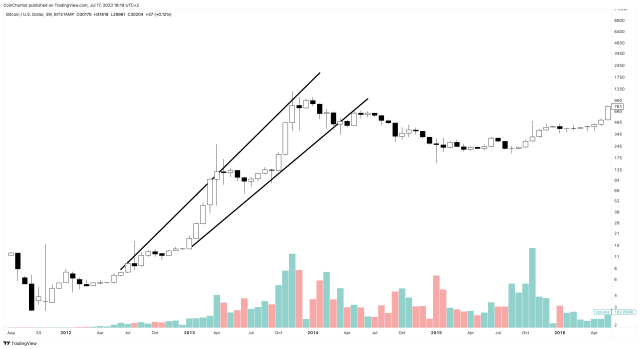
Price action follows two upward sloping trend lines which diverge to form a broadening structure. Price must also fill out the pattern with at least three touches of each trend line. Volume increases during the pattern.
What Is The Psychology Behind The Chart Pattern?
The Ascending Broadening Wedge pattern is a neutral to bearish chart pattern that can provide traders with valuable insights into the market’s psychology.
It’s characterized by two diverging trendlines that connect a series of higher highs and higher lows.
As price approaches the top of the wedge, it becomes increasingly difficult for buyers to push the price higher, resulting in a reversal.
Eventually, the price breaks out of the wedge to the downside, signaling a potential trend reversal.
Encyclopedia of Chart Patterns (Wiley Trading)
17% OffHow To Trade The Ascending Broadening Wedge Pattern?
To trade the Ascending Broadening Wedge pattern, traders typically wait for the price to break through the lower trendline with a strong volume surge.
The breakout should ideally occur on higher than average trading volume, as this confirms that there is significant selling pressure behind the move.
Traders may enter a short position depending on the direction of the breakout. A stop loss is placed on the opposite side of the wedge.
The profit target can be set based on the height of the pattern, with the expectation that the price will move at least the same distance as the pattern’s height in the direction of the breakout.
Alternatively, traders may wait for a pullback to the breakout level before entering a position.

This approach can provide a better risk-to-reward ratio, as the entry price is closer to the breakout level and the stop loss can be placed tighter.
However, it may also result in missing out on some of the initial gains from the breakout. Ultimately, the best approach will depend on the trader’s risk tolerance, trading style, and market conditions.
It’s worth noting that the Ascending Broadening Wedge pattern can also result in a false breakout. In this situation, price briefly breaks through the trendline before reversing course.
Traders should be aware of this possibility. Also be sure to use technical indicators and other tools to confirm the validity of the breakout. Access these tools at TradingView.
Ascending Broadening Wedge Performance Expectations Explained
A bearish breakdown can be expected 52% of the time.
To find potential targets, measure from the lowest trough to the highest peak.
Project the measurement multiplied by 61% for upward breakouts and 71% for downward breakdowns.